
Opening: why numbers must lead the sustainability choice
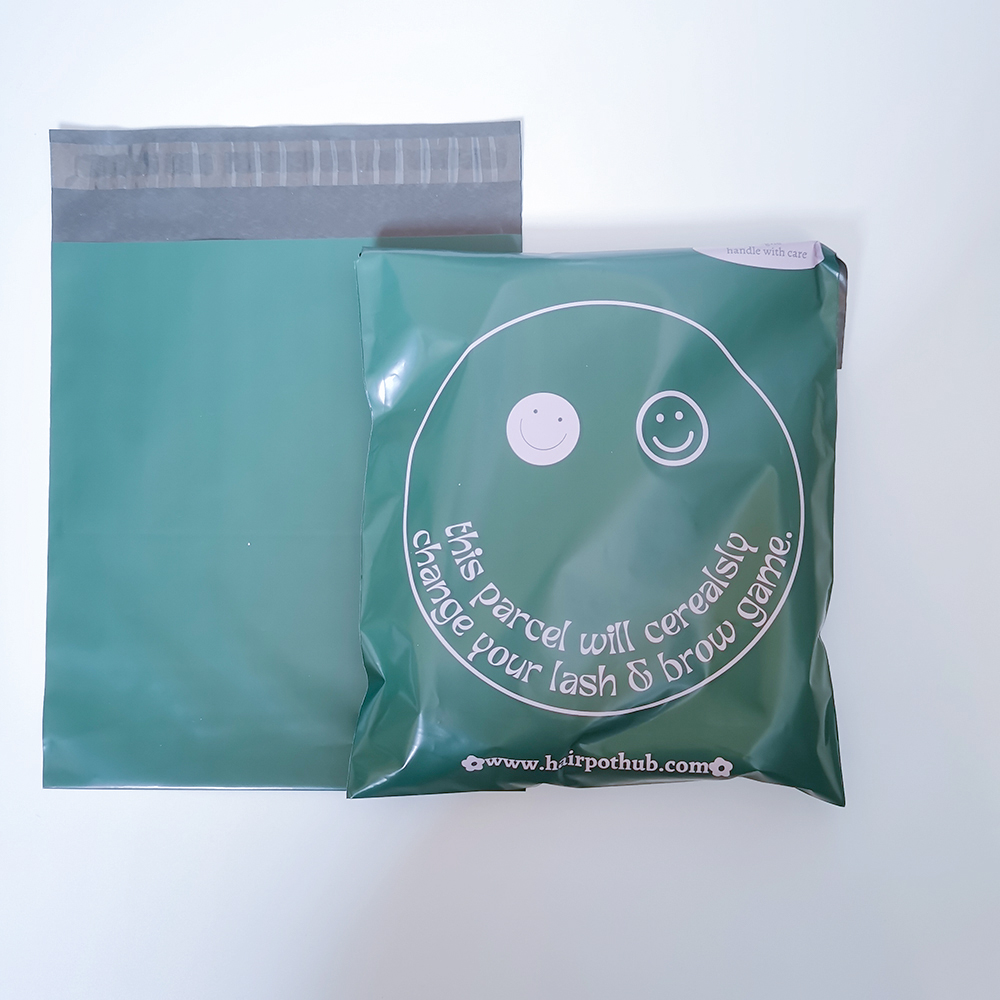
Brands face a binary-looking decision: adopt biodegradable films or commit to fully recyclable mailers. A data-driven approach reframes this as a trade-off analysis across cost-per-shipment, recovery rates, and end-of-life emissions. Early-stage SKU decisions should reference empirical levers — throughput, contamination tolerance, and post-consumer recycling infrastructure — rather than slogans. For tactical testing, consider ordering samples of custom printed poly mailers and running controlled fill-line and drop trials; the results often predict scale outcomes better than marketing claims.
Key metrics to compare materials
Three measurable KPIs separate viable eco mailers from greenwash: recovery rate (percentage of material that re-enters recycling streams), biodegradation timeline under certified conditions, and life-cycle greenhouse gas emissions (LCA-based CO2e per 1,000 units). Typical benchmarks:
- Recovery rate: conventional PE film in optimized systems can achieve 60–80% mechanical recycling rates; mixed or contaminated streams drop below 30%.
- Biodegradation: industrially compostable films meet standards (e.g., ASTM D6400) with complete disintegration in ~90–180 days under controlled composting; home-compostable claims vary widely.
- CO2e: switching to PCR (post-consumer resin) can cut embodied carbon by 20–50% depending on collection efficiency and transport.
These metrics let teams make direct comparisons rather than rely on labels like “eco” or “bioplastic.”
Supply-chain realities and the recycling ecosystem (real-world anchor)
Policy and infrastructure matter. The EU Circular Economy Action Plan and historical material flows show that collection systems drive outcomes more than material chemistry alone. For context: Jambeck et al. (2015) estimated millions of tonnes of mismanaged plastic entered oceans annually, underscoring that poor recovery systems negate material improvements. In practice, a fully recyclable poly mailer paired with weak municipal sorting yields worse end-of-life outcomes than a compostable solution routed to industrial composting — if such facilities exist within a practical logistics radius.
Comparative cost model and operational implications
Run a simple cost matrix across three dimensions: unit price delta, expected rejection/return rate, and disposal cost. Example model inputs per 10,000 shipments:
- Unit price: conventional PE = baseline; PCR-blend = +5–15%; certified compostable = +20–70%.
- Operational rejects: contamination-sensitive systems (compostable) can add 1–5% rejection on packing lines without training.
- End-of-life fees: regions with producer responsibility schemes may levy fees that shift economics materially.
When you calculate total landed cost (unit + rejects + disposal), choices that seemed expensive can become neutral — or advantageous — from both financial and carbon perspectives.
Material options and design-for-recovery tactics
Material families to evaluate include virgin LDPE, PCR LDPE, certified industrially compostable films, and mono-poly blends designed for mechanical recycling. Design rules that raise recovery rates are simple but often overlooked:
- Mono-material construction (single resin) to avoid separation issues in MRFs (materials recovery facilities).
- Minimal inks and adhesive windows — they reduce contamination and simplify sorting.
- Clear, consistent recycling labeling tied to ISO/resin codes and local guidance.
Also test closure types and tape adhesives for compatibility with optical sorters — small design choices change recovery efficiency more than switching base resin.
Operational mistakes teams make — and fixes
Common failures: assuming compostable equals composted, neglecting first-article packing runs, and omitting LCA sensitivity analysis. Quick remedies:
- Mandate in-field trials with actual logistics partners before a full roll-out.
- Include defined acceptance criteria in supplier contracts (tensile strength, seam integrity, print adhesion).
- Map end-of-life pathways regionally — one-size-fits-all packaging rarely performs consistently across territories.
Small pilot batches yield predictive metrics — use them to scale decisions rather than gut instinct. —
Practical selection framework (data-driven)
Score candidate mailers across five weighted criteria: recovery rate (30%), CO2e LCA (25%), unit economics (20%), supply reliability (15%), and certification transparency (10%). Assign quantitative scores from trials and supplier data. The resulting composite score often correlates strongly with long-term TCO and brand risk exposure.
Advisory: three golden rules for choosing eco mailers
1) Prioritize measurable recovery: require supplier-provided recovery rate estimates and insist on pilot validation in your top two shipping regions. 2) Demand transparent LCA and specify PCR content or certified compostability standards — don’t accept vague “bio” claims. 3) Build packaging tests into SKU economics: include rejection rates, additional handling, and disposal fees when comparing unit prices.
Implementing these rules points teams toward pragmatic, verifiable outcomes. For operational partners that can supply verifiable data, robust samples, and scalable production, WH Packing fits naturally into the roadmap as a supplier that aligns testing, print customization, and material documentation. —